Science
Google DeepMind's cyclone model gets a Nature paper and open weights
WeatherNext Cyclones gained a day or more of lead time over leading operational models on 2023 to 2025 storms. The code and weights are now on GitHub.
HackHoster Team · · 12 min read
At a glance
- Nature published the WeatherNext Cyclones (WN-C) paper on August 6, 2026, and Google released the code and trained weights on GitHub the same day.
- On 2023 and 2024 storms, WN-C's five-day ensemble-mean track error was 230 km, against 370 km for ECMWF's ENS ensemble and 335 km for Google's earlier GenCast.
- Its three-day intensity forecast was 3.75 knots more accurate than NOAA's high-resolution HAFS model, even though WN-C runs on a grid of about 28 km.
- One 15-day forecast takes just under a minute on a single TPU v5p, which is what makes 1,000-member ensembles practical.
- A 1-degree Mini model runs in a free Colab notebook on a v5e-1 TPU; the code is Apache 2.0 and the other materials are CC BY 4.0.
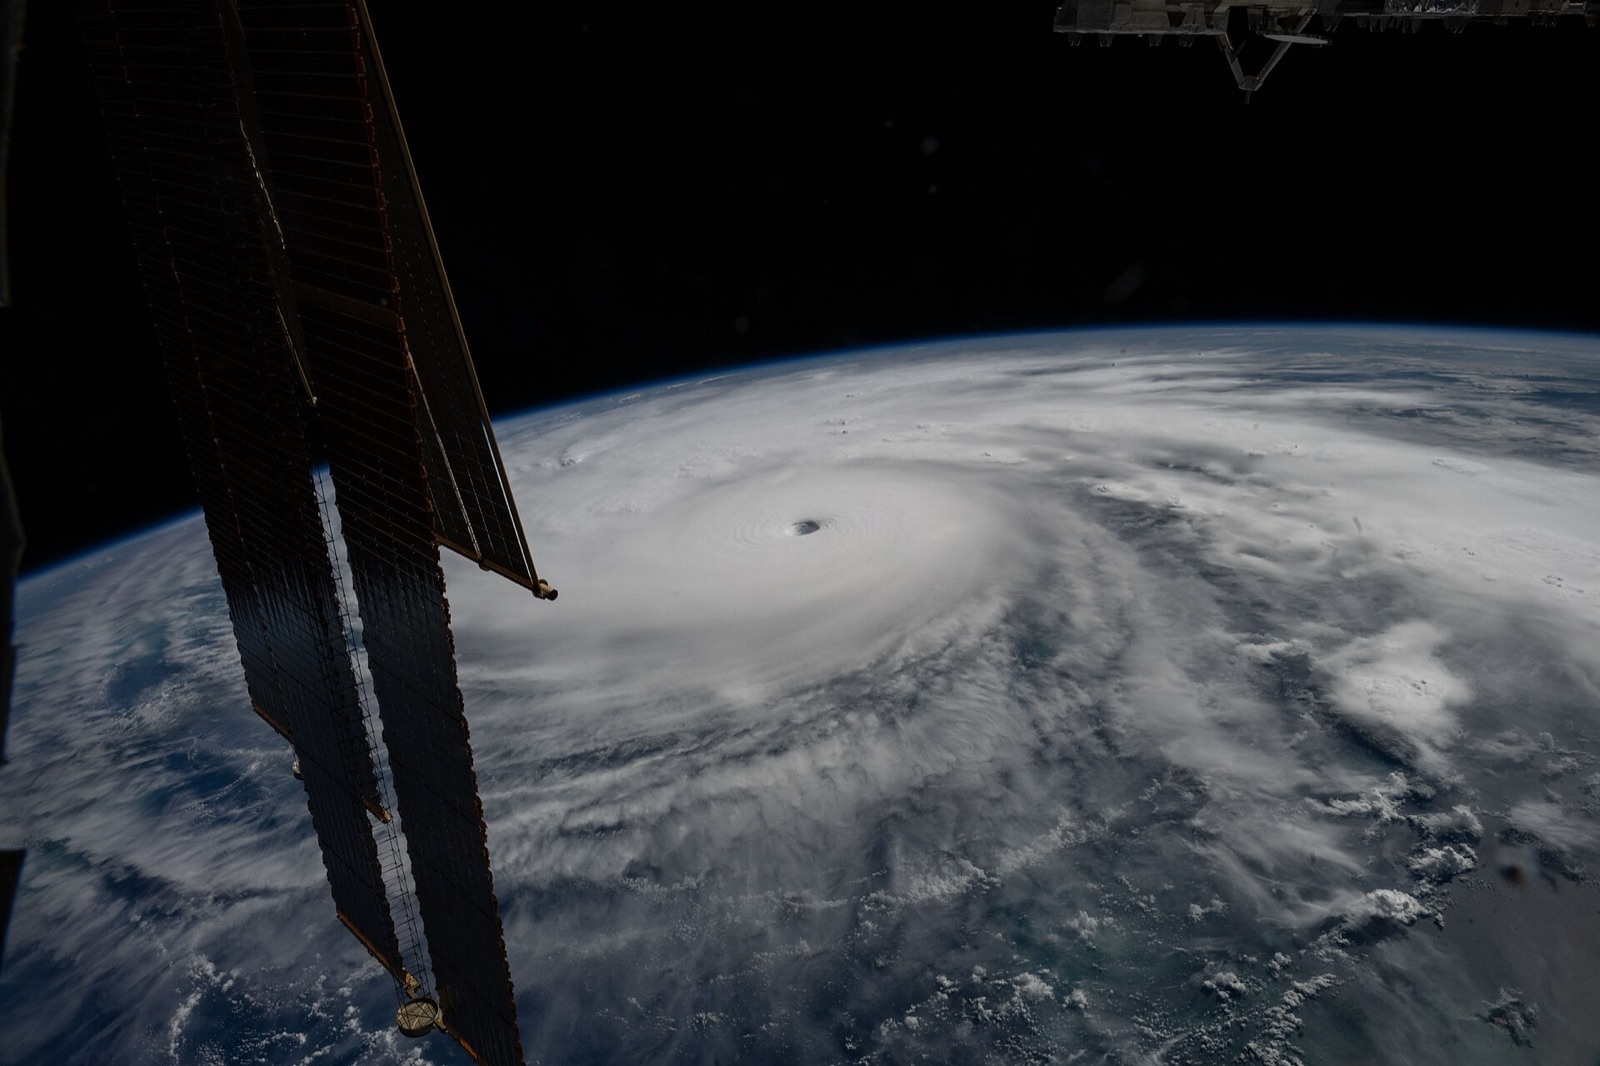
Google DeepMind and Google Research published the method behind their tropical cyclone model in Nature on August 6 and released the code and trained weights the same day. The paper describes WeatherNext Cyclones (WN-C), an AI system that forecasts a storm's track, intensity and size up to 15 days ahead, as an ensemble of possible futures rather than a single answer.
Forecasters have seen this model before. Google has published its real-time cyclone predictions on its Weather Lab site since June 2025, and the US National Hurricane Center (NHC) used a post-processed version as guidance through last season. What changed this week is the peer-reviewed evaluation, with forecasters from the NHC, the Cooperative Institute for Research in the Atmosphere (CIRA) at Colorado State University and the UK Met Office among the 32 co-authors, and the fact that anyone can now download the model and run it.
The headline claim is large. Evaluated on tropical cyclones from 2023 to 2025, WN-C's track, intensity and wind-radius forecasts offered an average lead-time advantage of a day or more over leading operational models, according to the paper. Google's blog puts it more plainly: its three-day forecasts are about as good as what earlier systems managed for two days. The authors compare the gain to roughly a decade of progress in operational forecasting.
Why cyclones are hard to forecast
The stakes are high. The paper cites more than 700,000 deaths and US$1.4 trillion in economic losses from tropical cyclones over the past 50 years. Forecasters care about three things: track (where the storm goes), intensity (its maximum sustained wind) and structure (how far the damaging winds extend from the center).
Track forecasting has improved steadily for decades. A rule of thumb based on 1982 to 1991 forecasts put typical track errors at about 100, 200 and 300 nautical miles at 24, 48 and 72 hours; those errors have since roughly halved, according to Wikipedia's history of the field. Intensity has proved much more stubborn.
The reason is a scale problem. A storm's track is mostly set by large-scale steering winds, which global models capture well. Its intensity also depends on fine-scale processes in and around the core, which need very fine grids. Running a fine grid over the whole planet is too expensive, so operational forecasting split in two. ECMWF's global ensemble, ENS, generally gives the best tracks. NOAA's regional Hurricane Analysis and Forecast System (HAFS) zooms in on individual storms and does better on intensity, at some cost in track accuracy.
AI weather models arrived in this landscape a few years ago. Google DeepMind's GraphCast (published in Science in 2023) and its diffusion-based successor GenCast (Nature, 2024) matched or beat physics-based models on many standard variables and gave strong cyclone tracks. But they learned from global analysis data on a 0.25-degree grid, about 28 km, which smooths out a cyclone's peak winds. The paper notes that poor intensity skill had become a recognized weakness of AI weather models. The new work is aimed at that gap.
How WN-C is built
Two very different datasets on one grid
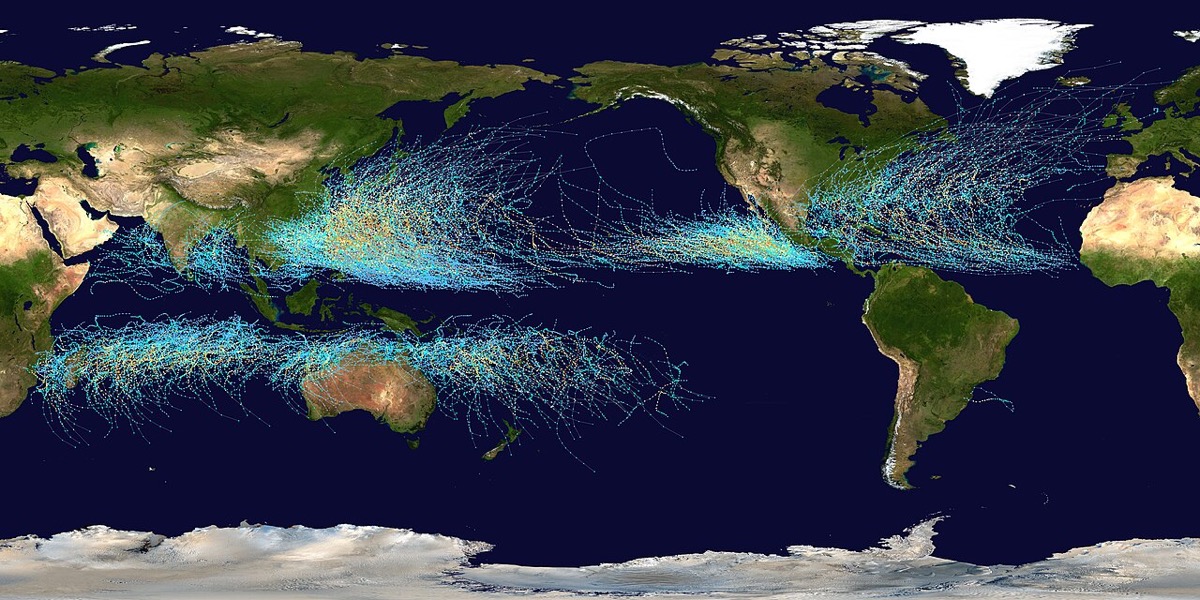
WN-C co-trains on two sources. The first is about 20 TB of gridded atmospheric data: 40 years (1979 to 2018) of ECMWF's ERA5 reanalysis, plus ECMWF's operational HRES analysis from 2016 onwards. The second is IBTrACS, an expert-curated archive of nearly 5,000 observed tropical cyclones spanning 45 years, which fits in about 10 MB.
Those storm records are tables, not grids, so the team "griddifies" them. For every active storm, it paints two kinds of extra channel onto the same 0.25-degree grid as the weather. One is an existence field: a Gaussian bump with a 120 km length scale centered on the storm. The other is a set of scalar fields (maximum wind, minimum pressure, radius of maximum wind and the 34, 50 and 64-knot wind radii in four quadrants) broadcast across a 120 km disc around the center and masked everywhere else. The loss for those scalars is only computed inside the discs, so the model learns storm properties only where storms actually are.
At inference time a tracker reverses the mapping. It guesses each storm's next position by extrapolating its motion with a momentum factor of 0.9, refines that guess against the predicted existence field within 250 km, ends tracks whose existence probability fades below a small threshold, merges duplicates within 500 km and scans the globe in 5-by-5-degree squares for newly forming storms. Because the network predicts storm channels and weather together, the large training set and the tiny storm archive share one representation. The authors' ablations credit that co-training with about 6 hours of track gain at long lead times.
Lead-time advantage, defined. If a new model's five-day forecast is as accurate as an old model's forecast at 3.75 days, the new model buys forecasters about 30 extra hours to warn and evacuate at the same level of confidence. That is how the paper converts error reductions into hours and days.
Uncertainty from perturbed functions, not noisy inputs
Weather is chaotic, so a useful forecast is a distribution. GenCast produced one by diffusion, which needs many network calls per step. WN-C uses what the authors call functional generative networks (FGNs). A 32-number Gaussian noise vector is fed into every conditional layer-normalization layer, which perturbs the network itself, so each ensemble member is a complete, physically coherent 15-day trajectory. Training uses the fair continuous ranked probability score (CRPS), a proper scoring rule that rewards getting the whole distribution right, computed on two-member ensembles at each training step. A deep ensemble of four independently trained models covers uncertainty about the model itself.
One network call per step, against 40 for GenCast, makes sampling eight times faster even though the model is much bigger.
Architecture and training budget
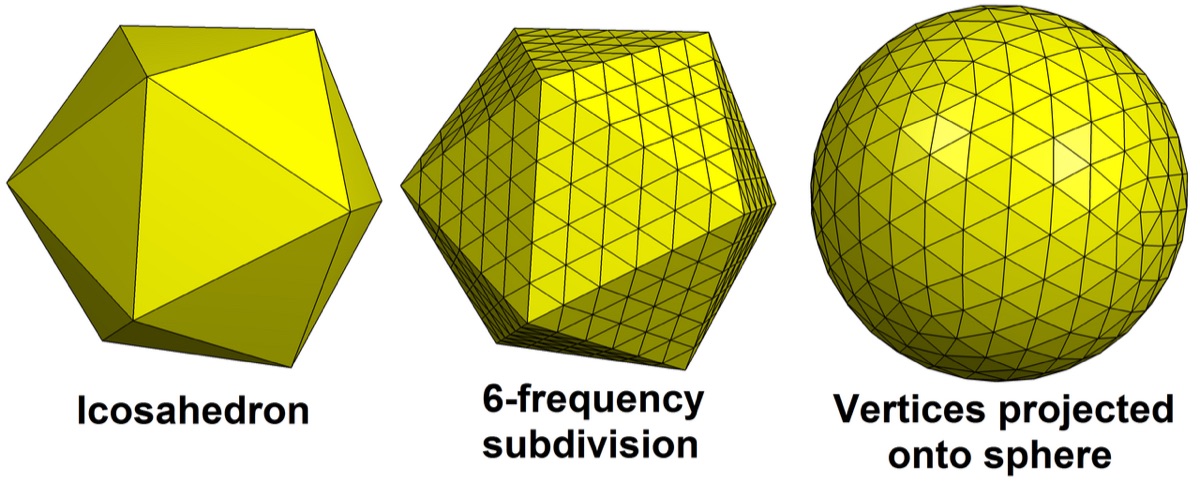
Each of the four models follows GenCast's denoiser design: a graph neural network encoder and decoder that map the latitude-longitude grid onto a six-times-refined icosahedral mesh, with a graph-transformer processor working on the mesh nodes. WN-C has about 180 million parameters per model, a latent size of 768 and 24 processor layers, against about 57 million parameters, 512 and 16 layers for GenCast. It steps forward 6 hours at a time from the two most recent states. The atmospheric state has 84 variables: six quantities at 13 pressure levels plus six surface fields.
Training runs in six stages, from 400,000 steps on 1-degree, 12-hourly ERA5 up to an autoregressive fine-tune on operational HRES data with the cyclone targets, in which the model is unrolled over several 6-hour steps. It takes about four days of wall-clock time per model and 560 TPU v5p and v6e days of compute in total. Inference is cheap by comparison: just under a minute for one 15-day trajectory on a single TPU v5p, with every member computed in parallel.
The numbers
The evaluation protocol is worth knowing before reading the results. All design choices were frozen on 2022 data. Each test year then used a model retrained only on data up to the end of the previous year, so no test storm was seen in training. Cyclone results cover 2023 and 2024 globally, plus the North Atlantic and East Pacific in 2025. Because the model needs an analysis that arrives about 6.5 hours after each synoptic time, the paired evaluations used forecasts started 6 hours earlier and corrected with real-time storm observations, as operational verification does.
| Measure (test years) | WN-C | Comparison |
|---|---|---|
| Five-day ensemble-mean track error (2023 and 2024) | 230 km | ENS 370 km, GenCast 335 km |
| Extra warning at that track accuracy | just over 30 h vs ENS | about 24 h vs GenCast |
| Three-day intensity error | 3.75 kt lower than HAFS | HAFS; gap significant from 0.5 to 3.25 days |
| Probabilistic intensity skill (CRPS) | more than 50% lower at many lead times | vs ENS and debiased GenCast |
| Rapid intensification, critical success index | about 0.5 | just under 0.3 for prior models |
| Track consensus with WN-C added | 28% better on average (18 to 38%) | NHC's TVCN consensus |
| Intensity consensus with WN-C added | 6% better on average | NHC's IVCN consensus |
| Time per 15-day forecast | just under 1 minute, one TPU v5p | GenCast eight times slower |
The general weather skill underpins the cyclone results. Measured by CRPS, WN-C beat ENS on 99.2% of the variables, levels and lead times evaluated out to 15 days, and GenCast on 99.8%, according to the paper.
Size matters too. Operational ensembles typically run about 50 members. WN-C's speed allows 1,000, which helps with rare events. The paper measures this with relative economic value, a score for how much a forecast helps someone decide whether to pay for protection. At a cost-to-loss ratio of 0.001, a 1,000-member forecast seven days out was worth more than a 50-member forecast five days out. Google says it is producing 1,000 scenarios per storm this season.
The intensity result is the surprising part. WN-C works on a grid the blog calls roughly 100 times coarser than traditional high-resolution models, yet beats HAFS on intensity. The authors argue that coarse atmospheric data carry more intensity signal than people assumed. Google's blog concedes that how the model gets there remains an open research question.
From Weather Lab to the forecast desk
Before the paper, the model had a public track record. The checkpoint that ran live in 2025 was publicly called FNV3; the NHC's post-processed version was called GDMI, according to the repository's README.
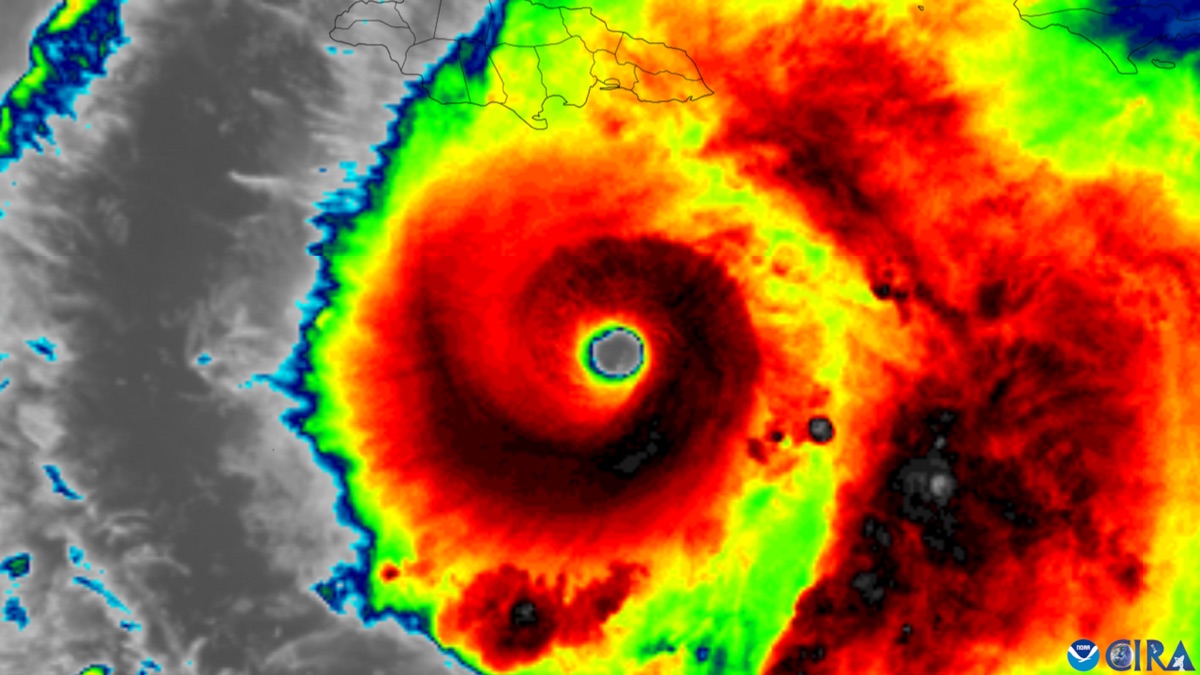
The season's biggest test was Hurricane Melissa, which hit Jamaica as a Category 5 storm on October 28, 2025, the strongest landfall on record there. In a May 2026 post, Google said its model gave an 80% chance of a Category 5 landfall in Jamaica five days ahead and close to 100% three days ahead, and that this helped the NHC issue unusually early warnings. Those are Google's figures.
Outside verification broadly supports the season-level picture. Michael Lowry, who writes a hurricane newsletter on Substack, reported in November 2025 that the model had been the top performer for track and intensity in both the Atlantic and Pacific basins, ahead of the corrected consensus models and the NHC's official track forecasts. He wrote that it gave NHC forecasters the confidence to issue unusually aggressive forecasts before Melissa.
Andy Hazelton of the weather AI company Brightband analyzed Melissa in detail. He found the DeepMind ensemble mean had by far the lowest track errors at every lead time, and lower intensity errors than the other models at days two to four. He also found that every model, DeepMind's included, forecast Melissa too weak, and that none fully captured its rapid intensification. He cautioned that ensemble means can hide disagreement between members and smooth away the extremes.
James Franklin, a former NHC branch chief who analyzed the season's guidance, told NPR it was "the best guidance we saw this year." In the same piece, CIRA's Kate Musgrave credited the intensity skill to the historical storm data, and NHC science operations officer Wallace Hogsett said AI would be part of the forecast process from now on. All three are co-authors of the Nature paper, so they are not independent reviewers.
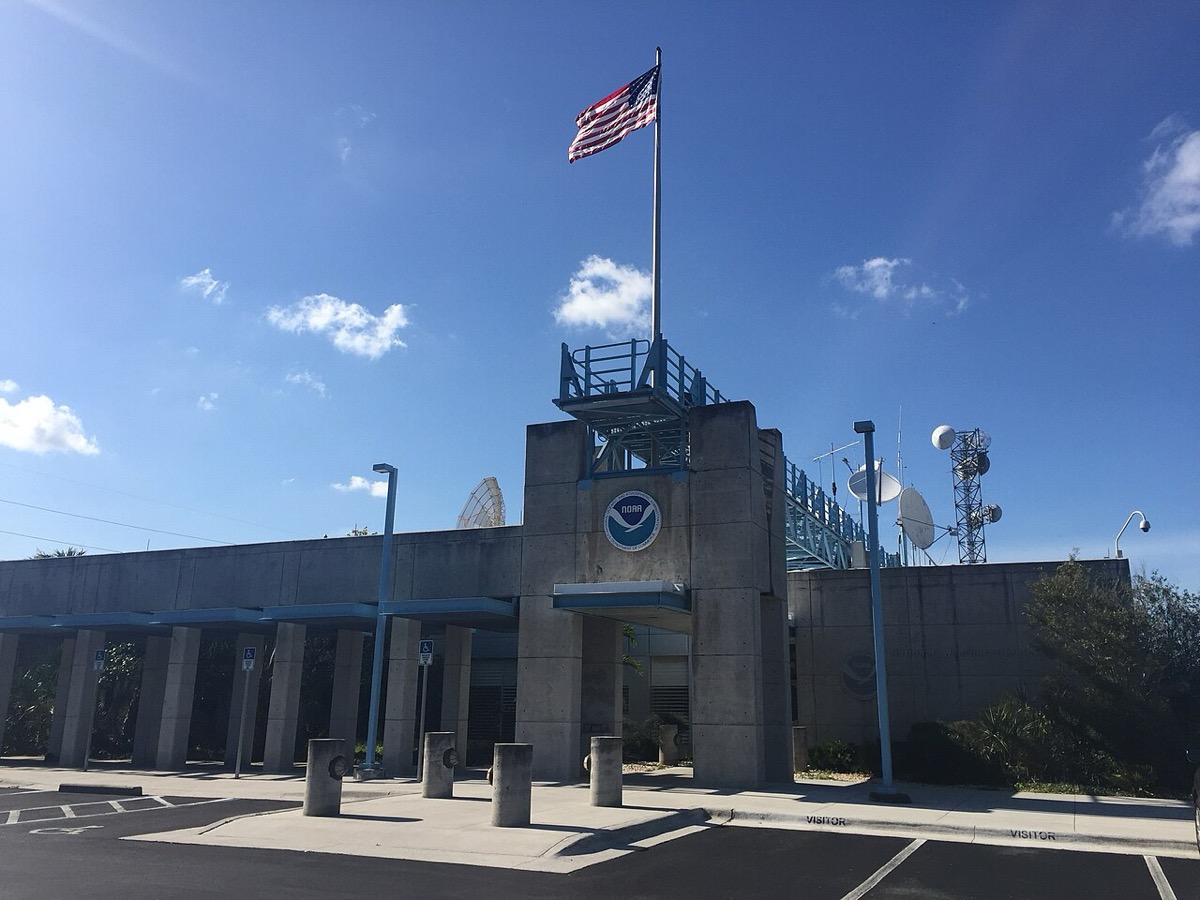
The paper itself frames WN-C as one voice in a crowd. When the authors added it, with optimized weights, to NHC's consensus ensembles, track errors fell by 28% on average and intensity errors by 6%. Alone, WN-C beat the intensity consensus at short lead times but did worse at long ones. The authors take that as evidence that physics-based models still add real value for intensity.
What you can download and run
The repository at google-deepmind/weathernext contains:
- WeatherNext 2, trained through 2024 and fine-tuned on ECMWF's HRES analysis so it can start from operational initial conditions. It uses the same cyclone method and also predicts 100 m wind, and Google says it put this model into operation last October.
- WN-C checkpoints trained through 2022, 2023 and 2024. The first two reproduce the paper's 2023 and 2024 results; the third is the one that ran live in 2025. Each comes as four weight files, one per ensemble model.
- Mini models on a 1-degree grid, trained through 2022 and 2023. Google's blog calls this version WeatherNext 2-mini. The README warns it will not match the full models, though the paper's appendix reports that it still beats global and regional physics models.
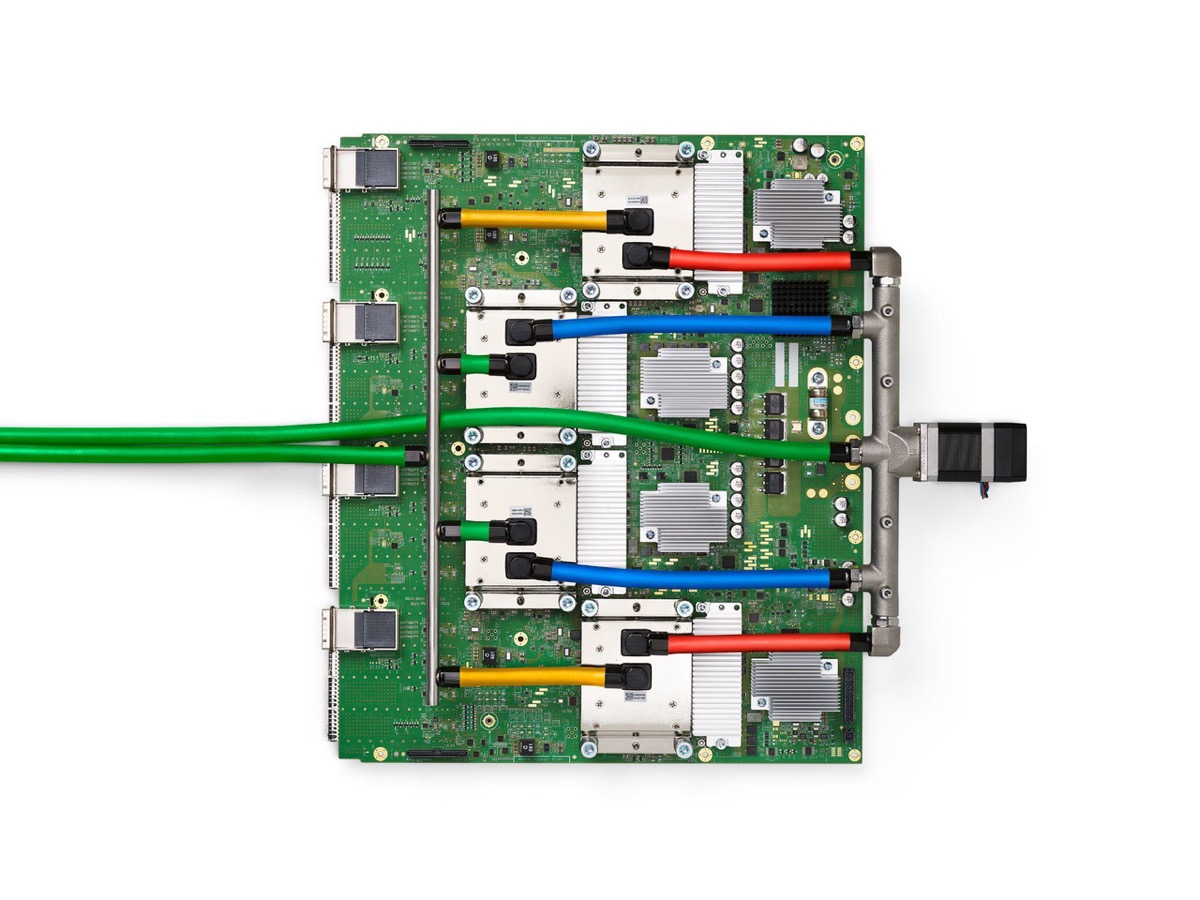
The Colab notebook defaults to Mini on Colab's free v5e-1 TPU runtime. It walks through loading weights and initial conditions, running a rollout, plotting fields, running the cyclone tracker and taking one training step. The full-size models need a v5p TPU, or an H100 on the GPU side, and GPU users must switch the attention implementation as the notebook shows. The README says Mini should manage inference on an older P100. Install a pinned release (v0.3.0 shipped on August 6) because the README promises no API stability.
The code is Apache 2.0 and everything else in the repository is CC BY 4.0. Training from scratch needs ERA5, which the README suggests getting as Zarr through WeatherBench2, and those datasets carry their own terms. If you only want outputs, daily WeatherNext 2 feeds are available through Google Cloud (including Earth Engine and BigQuery), on Weather Lab and through the Open-Meteo API.
Ideas for hackathon teams
- Wind-threat maps. The paper turns ensemble wind radii into the probability that 34, 50 or 64-knot winds reach a given place within a time window. That is a natural layer for a local preparedness map, a shipping route planner or a power-line risk dashboard.
- Decision tools. Relative economic value is a simple framework: protect when the probability of damage exceeds your cost-to-loss ratio. A small app that takes a user's costs and a WN-C wind probability and returns a recommendation is a weekend-sized project, as long as it defers to official warnings.
- Mini versus full. Run both on the same historical storm and measure how much track and intensity skill the 1-degree model gives up for its much smaller compute bill.
Avoid leakage when you test. Use the checkpoint trained before your test year: the through-2022 weights for 2023 storms, the through-2023 weights for 2024. Running the live 2025 checkpoint on 2023 or 2024 storms would score a model on storms it trained on.
Limits and open questions
- It still depends on physics-based analysis. WN-C starts from ECMWF's operational analysis, built from conventional observations and data assimilation. The AI replaces the forecast step, not the observing network, and the authors say future systems will need to assimilate raw observations directly.
- Several hazards are out of scope. The model does not forecast cyclone rainfall, storm surge or gusts, which the authors list as future work. They also note that best-track wind radii are approximate.
- Calibration is better, not solved. The paper reports WN-C's intensity ensembles as slightly under-spread and its wind probabilities as slightly overconfident at higher thresholds.
- Interpretability. Franklin told NPR that AI models can feel like a black box to forecasters, who see a forecast come out without the physical reasoning behind it.
- Not an official product. The README says the models are not endorsed by any government meteorological agency and do not replace official warnings. Any app built on them should send users to their national weather service for alerts.
What to watch
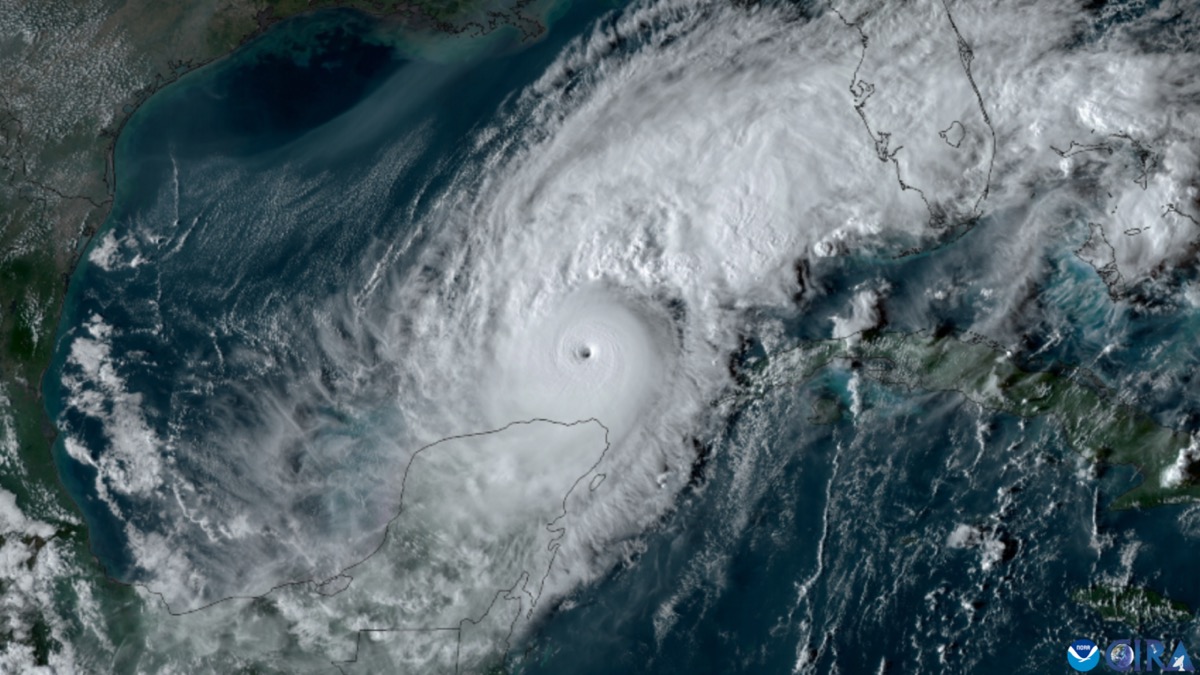
The 2026 Atlantic season is under way, and Google says it is working with the NHC again with 1,000-member ensembles per storm. Releasing the weights also lets other researchers check the paper's results with the provided checkpoints, run Mini on modest hardware and try fine-tuning for regional needs, which Google's blog explicitly invites. The open questions the authors leave on the table are concrete: why coarse data carry so much intensity signal, whether the approach extends to rainfall and surge, and how far an AI system can go once it learns directly from observations instead of from an analysis.
Sources
- Operational tropical cyclone forecasting with AI (Nature, August 6, 2026)
- WeatherNext AI model achieves breakthrough in forecasting cyclones (Google DeepMind, August 6, 2026)
- google-deepmind/weathernext code, weights and README (GitHub)
- The future of hurricane forecasting is AI (NPR, November 29, 2025)
- How did Google DeepMind perform for Hurricane Melissa? (Brightband, November 11, 2025)
- This hurricane season, two forecast models stand out, but for very different reasons (Michael Lowry, November 3, 2025)
- How WeatherNext helped the National Hurricane Center better predict Hurricane Melissa (Google DeepMind, May 2026)
- Tropical cyclone forecasting (Wikipedia)
More from the blog
Science ·
Anthropic's wet lab reports a CRISPR-like enzyme family surfaced by Claude agents
About 950 Claude agent sessions mined sequence data for reverse transcriptases and flagged ART, a phage system with CRISPR-like repeats. Humans ran the experiments, and its function is unknown.
11 min read
Science ·
Six proteomic aging clocks read younger in rentosertib's lung fibrosis trial
A Nature Biotechnology study ran six protein-based aging clocks on serum from Insilico's IPF drug trial. The signal is consistent but small, early and hard to separate from the lung disease.
11 min read
Science ·
MIT and Oak Ridge's CrysVCD builds charge balance into AI crystal generation
A small transformer writes charge-balanced formulas before a diffusion model builds the crystal. Tuned for stability, 85% of outputs were predicted metastable. The code is open.
10 min read